DANCE INDUSTRY CENSUS FINDINGS & KEY TAKEAWAYS
Page Updated Monday, April 10, 2023, 1:35 p.m.
DATA ON INDIVIDUAL WORKERS
As of April 7, 2023
Response goal is set as 25% of the known universe of 6000 dance workers in NYC.*
The Dance Industry Census has met this response goal by engaging an estimated 1,578 NYC dance workers.
Top Key Takeaways (As of December 19, 2022)
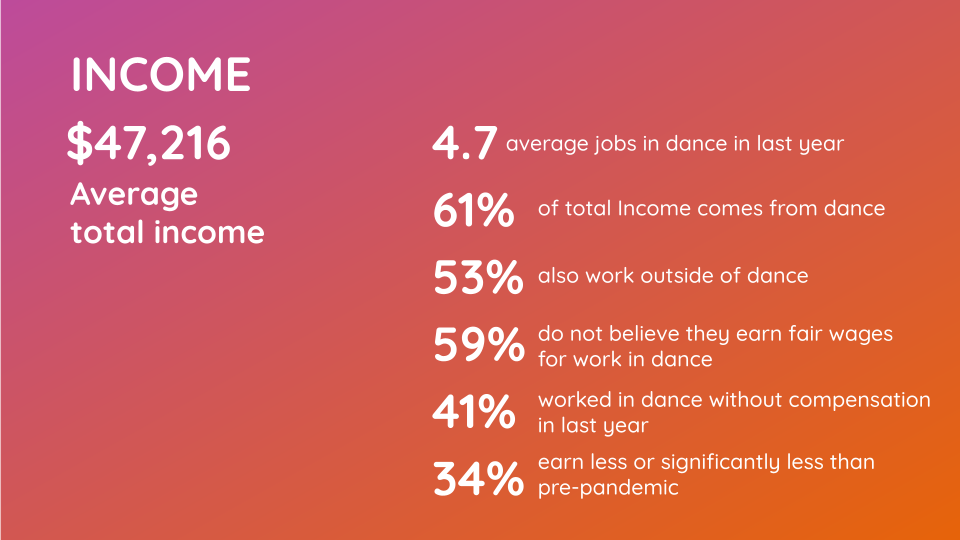
- Most dance workers earn limited income from their work in dance; thus, they have many jobs each year, including jobs outside of dance.
- Most dance workers believe they are not paid fair wages. Many have done some level of work for no pay over the last year, and many earn less or significantly less than they did before the pandemic.
- Nonetheless, dance workers feel positive about the content of their work in dance. Many report feeling fulfilled, connected, happy, inspired, alive, creative, and proud. They also feel exhausted, tired, challenged and frustrated.
- Dance workers need access to basics like work/job opportunities, pay, funding, space and benefits.
Facts & Figures (Preliminary Results)
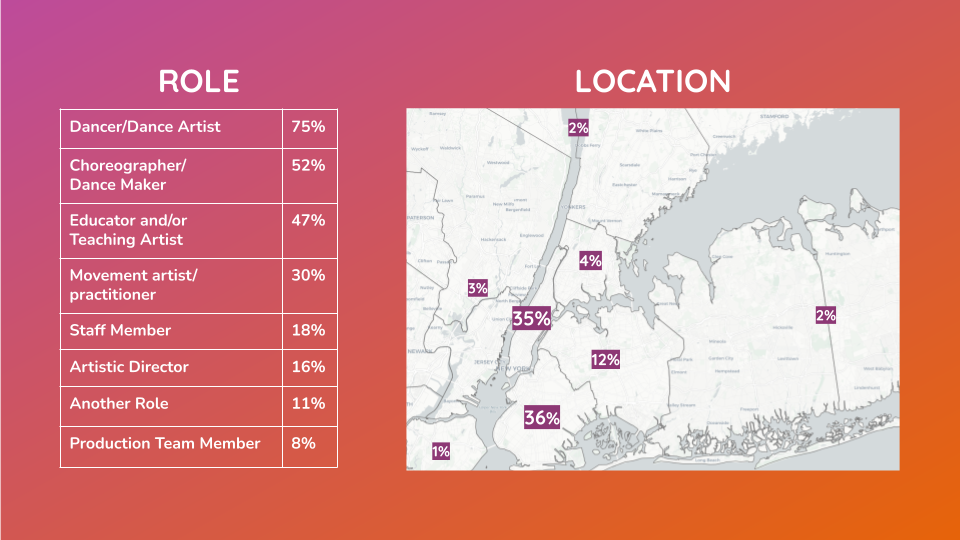
- At least 75% of responding dance workers are artists or choreographers. Many are also educators.
- 35% of dance workers live in Manhattan and 36% live in Brooklyn, meaning that very small proportions live in the Bronx, Queens, Staten Island, Long Island and New Jersey.
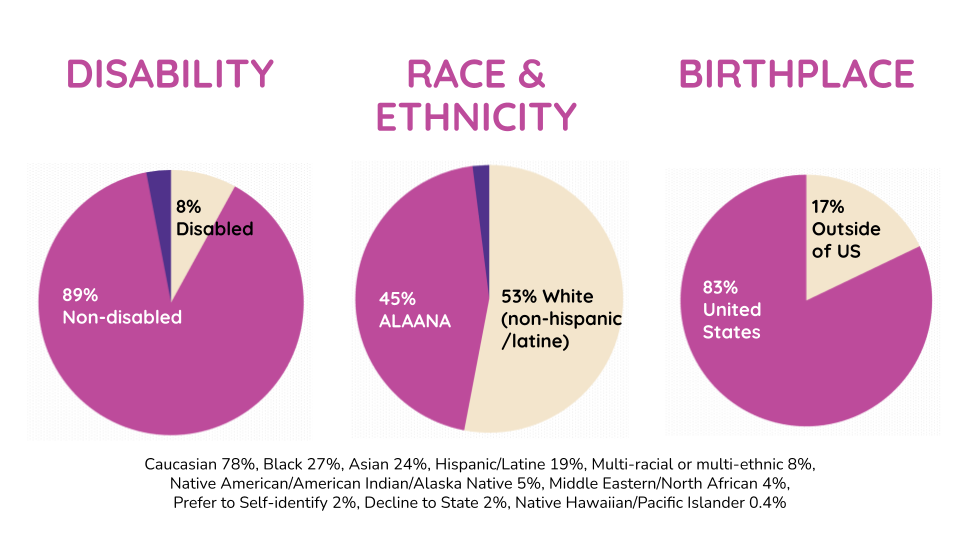
- About 8% of this group of dance workers identify as disabled, about 45% are ALAANA and about 17% are immigrant folks who were born outside of the United States. This means ALAANA and immigrant folks are underrepresented in preliminary survey results compared to what we know about our community and compared to New York City.
- Dance workers earn an average total income of $47K from an average of 4.7 annual jobs in dance per year; 53% also work outside of dance.
- Less than half of dance workers have access to dental and/or retirement benefits, or paid time off, and 19% do not have access to any benefits, including mental health care and/or support.
Quotes
“Dance has been my life. It has been the source of great happiness for me. It was what I was meant to do. And I am so lucky to have had a life where I knew this and could pursue this dream.”
“...As a dance archivist, I engage with many dance elders who are in dire shape financially and have very little support and resources…to fall back on. I'm often fearful that I'll end up in a similar situation as I age in the field.”
“I worked in the industry for 10+ years…I got tired of seeing [abusive] behavior excused and no real changes to correct systemic problems...low pay, terrible working conditions, and long hours.”
DATA ON ORGANIZED ENTITIES
As of April 7, 2023
Response goal is set as 25% of the known universe of 1700 organized dance entities in NYC.*
The Dance Industry Census has not yet met this response goal by engaging an estimated 358 NYC dance entities.
Top Key Takeaways (As of December 19, 2022)
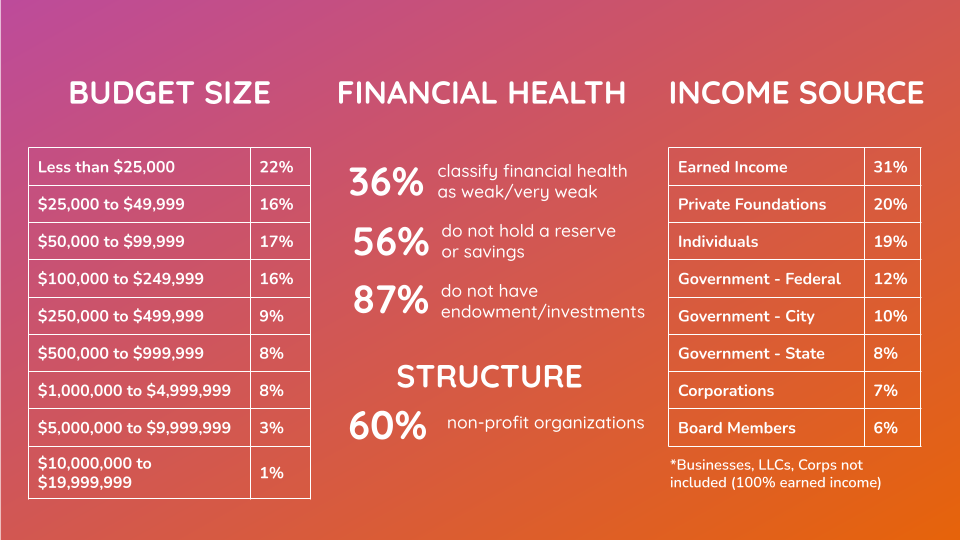
- Most organized entities are small-budget with limited financial resources, a lack of financial strength and challenges accessing funding.
- The majority are non-profit entities without endowment or investments.
- Many organized entities have devoted policy and resources to diversity, equity and inclusion, as well as accessibility, but there is more work to do.
Facts & Figures
- 75% are producing dance programs–including dance companies.
- The majority (or 51%) are located in Manhattan, while 24% are located in Brooklyn, and small proportions are located in the other boroughs and regional areas.
- 61% have budgets of less than $250K.
- 36% classify their financial health as weak or very weak; 56% do not hold a reserve or savings; 87% do not have endowment or investment accounts.
- 39% of entities do not have a formal Diversity, Equity & Inclusion (DEI) policy.
- 27% do not provide accessibility accommodations.

Quotes
“It is important to find LONG TERM solutions. We have to pay "salaries" to dancers and all the team around them. We have to keep audiences engaged and aware. We have to organize a dancers union…”
“My group is funded by jobs I take outside the field of dance.”
“There are not enough grants, not enough long-term support. Commissions are too low and not enough. Space rentals are too expensive.”
*Response goals are set as 25% of the known universe of dance workers (approx. 6000) and organized dance entities (approx. 1700). That universe has been defined using data sources from US, New York and New York City governments and publications as well as relevant service organizations including fiscal sponsors.